
Educational Analytics in SEQTA Teach
Data analytics is touted as an important tool in future education to track the impact of teaching and learning decisions on student performance, but more so, to identify those factors in performance that can inform a school’s decisions for change. Many of these systems are large and promise to deliver functionality that will automatically and seamlessly identify knowledge from a vast array of educational data. We have looked at some systems, and we continue to search for a system that can deliver on its promises.
In the meantime, many of us underestimate the value of simple visualisation of the academic data to reveal individual performance as opposed to looking at a table of numbers. The SEQTA Suite provides a simple means to record multiple instances of standardised testing data against each student. NAPLAN is one such instrument. A snapshot of individual performance relative to the cohort percentile spread is given as a box and whisker plot in the image below.
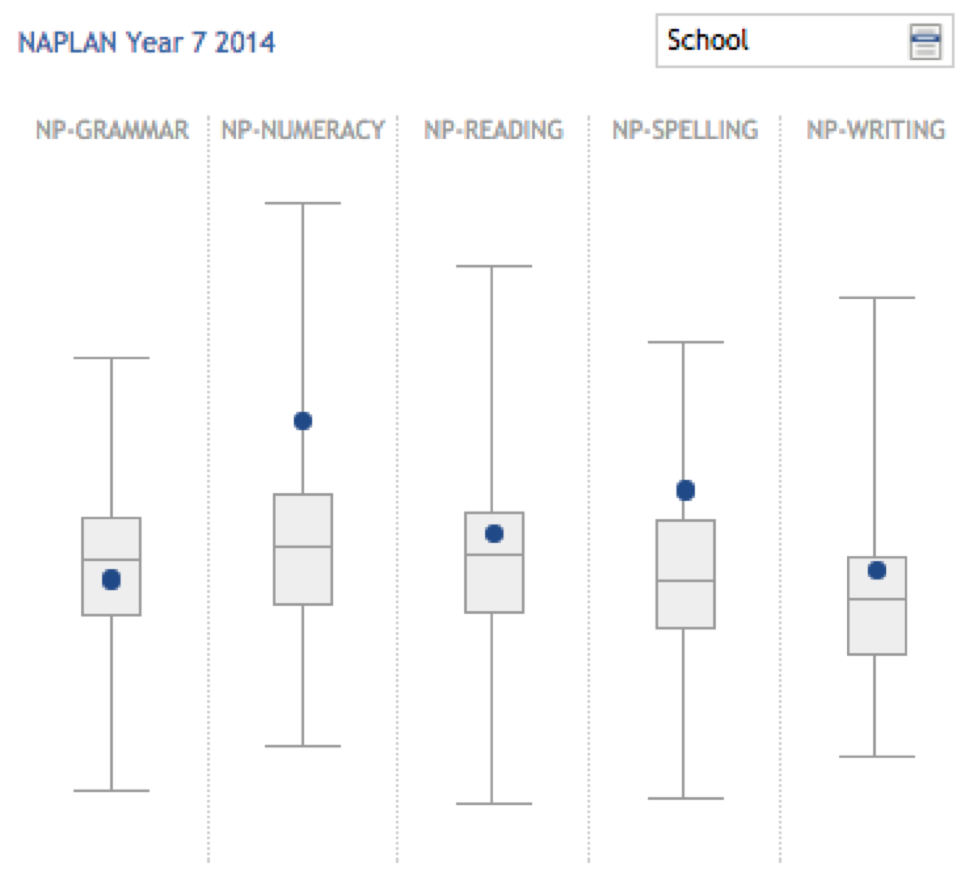
The view is invariably of the results across five areas, measured in a particular year when the student is in a particular year group. The next set of performance data will be two years later, and will be laid out in the same way. These views make it difficult to track individual progress over time.
At Scotch, we supplement the NAPLAN data with Allwell data collected every other year. This means we have a measure of performance every year. While there are some differences between NAPLAN and Allwell they both report to the same scale and they have three measures in common, Numeracy, Reading and Writing. To visualise individual progress, we create an instrument that is an amalgamation of NAPLAN and Allwell. The snapshot we use displays the results for one specific measure (Numeracy, Reading or Writing) for each academic year grouped by the cohort leaving year. The image below shows a student’s performance in Numeracy from Year 6 to Year 10 with statistics for his cohort year, L2019 (those students graduating Scotch College in 2019).
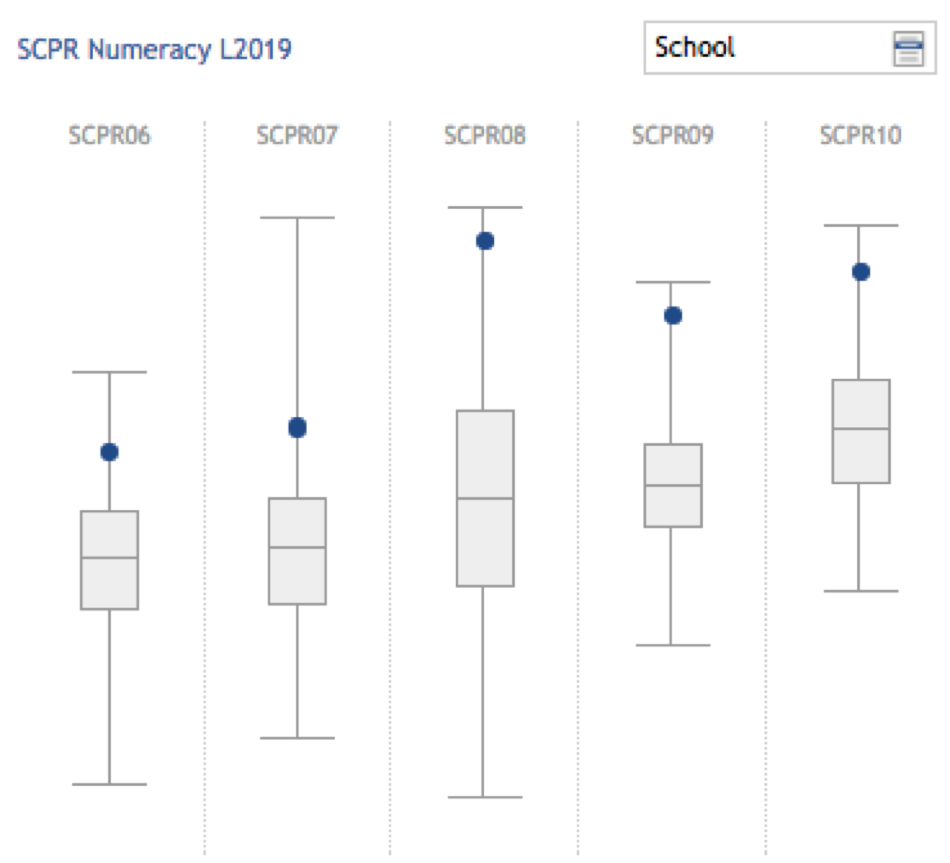
The image shows what one would hope to see with simple visualisation. A general trend in cohort performance, given by the middle 50% of the cohort (indicated by the “box”), is a steady improvement on the scale from Years 6 to 10. Furthermore, this particular student began his schooling at just above the 75th percentile in Years 6 and 7 but over the last three years has significantly improved his performance in Numeracy relative to his cohort to be operating closer to the 90th percentile.
Our teachers, academic support and pastoral care teams use these various views of our standardised testing data to be informed of a boy’s progress, and to ensure they “know the boy”.


Comments